Interactive charts and maps bring UK industrial reporting to life
The challenge
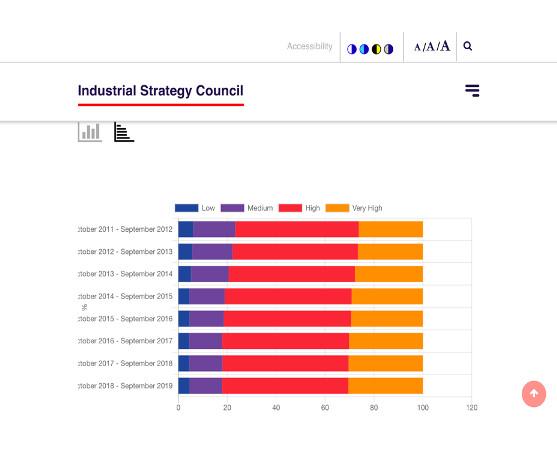
The Industrial Strategy Council provides an impartial and expert evaluation of the UK Government’s industrial strategy and its impact on the economy. It can be a complex subject to report so, as well as delivering a new website for ISC, we were commissioned to help content editors publish information as interactive charts and maps.

The process
We designed and installed an advanced app that allows content editors to convert raw data into a range of interactive charts and maps within the back-end of the CMS and publish it on the ISC website - on standalone pages or embedded within other content. The fully customisable solution includes a simple toggle function to allow users to view the same dataset in different formats (line, bar or pie chart, for example) that can also be downloaded as images.
The results
Today, the Drupal-based ISC website is optimised to help editors create and manage their content easily and efficiently – improving the accessibility of often complex data and statistical information for external audiences.
An intuitive back-end interface manages options and preferences (including sidebar content, accordions and tabs, carousels, colour-coordinated elements and lists of related content), while clear taxonomies power dynamic view and filter options for users.

Ongoing services
Since launch, we have hosted, maintained and supported the website and provide ad-hoc development and content management services.

“I had no experience of setting up a website but I enjoyed working with CIVIC, who were generous in their time in explaining the process. I’ve learned a lot.”
Sharon Griffiths, Industrial Strategy Council


